Skip to content

The Wealth Management Platform

Built to scale your wealth.

Research, manage and measure your wealth in one place, with AI that answers from your own data and cites every number.

Free full access during early access. No card required.

We propose. You decide. We never place orders.

Command Center · My book
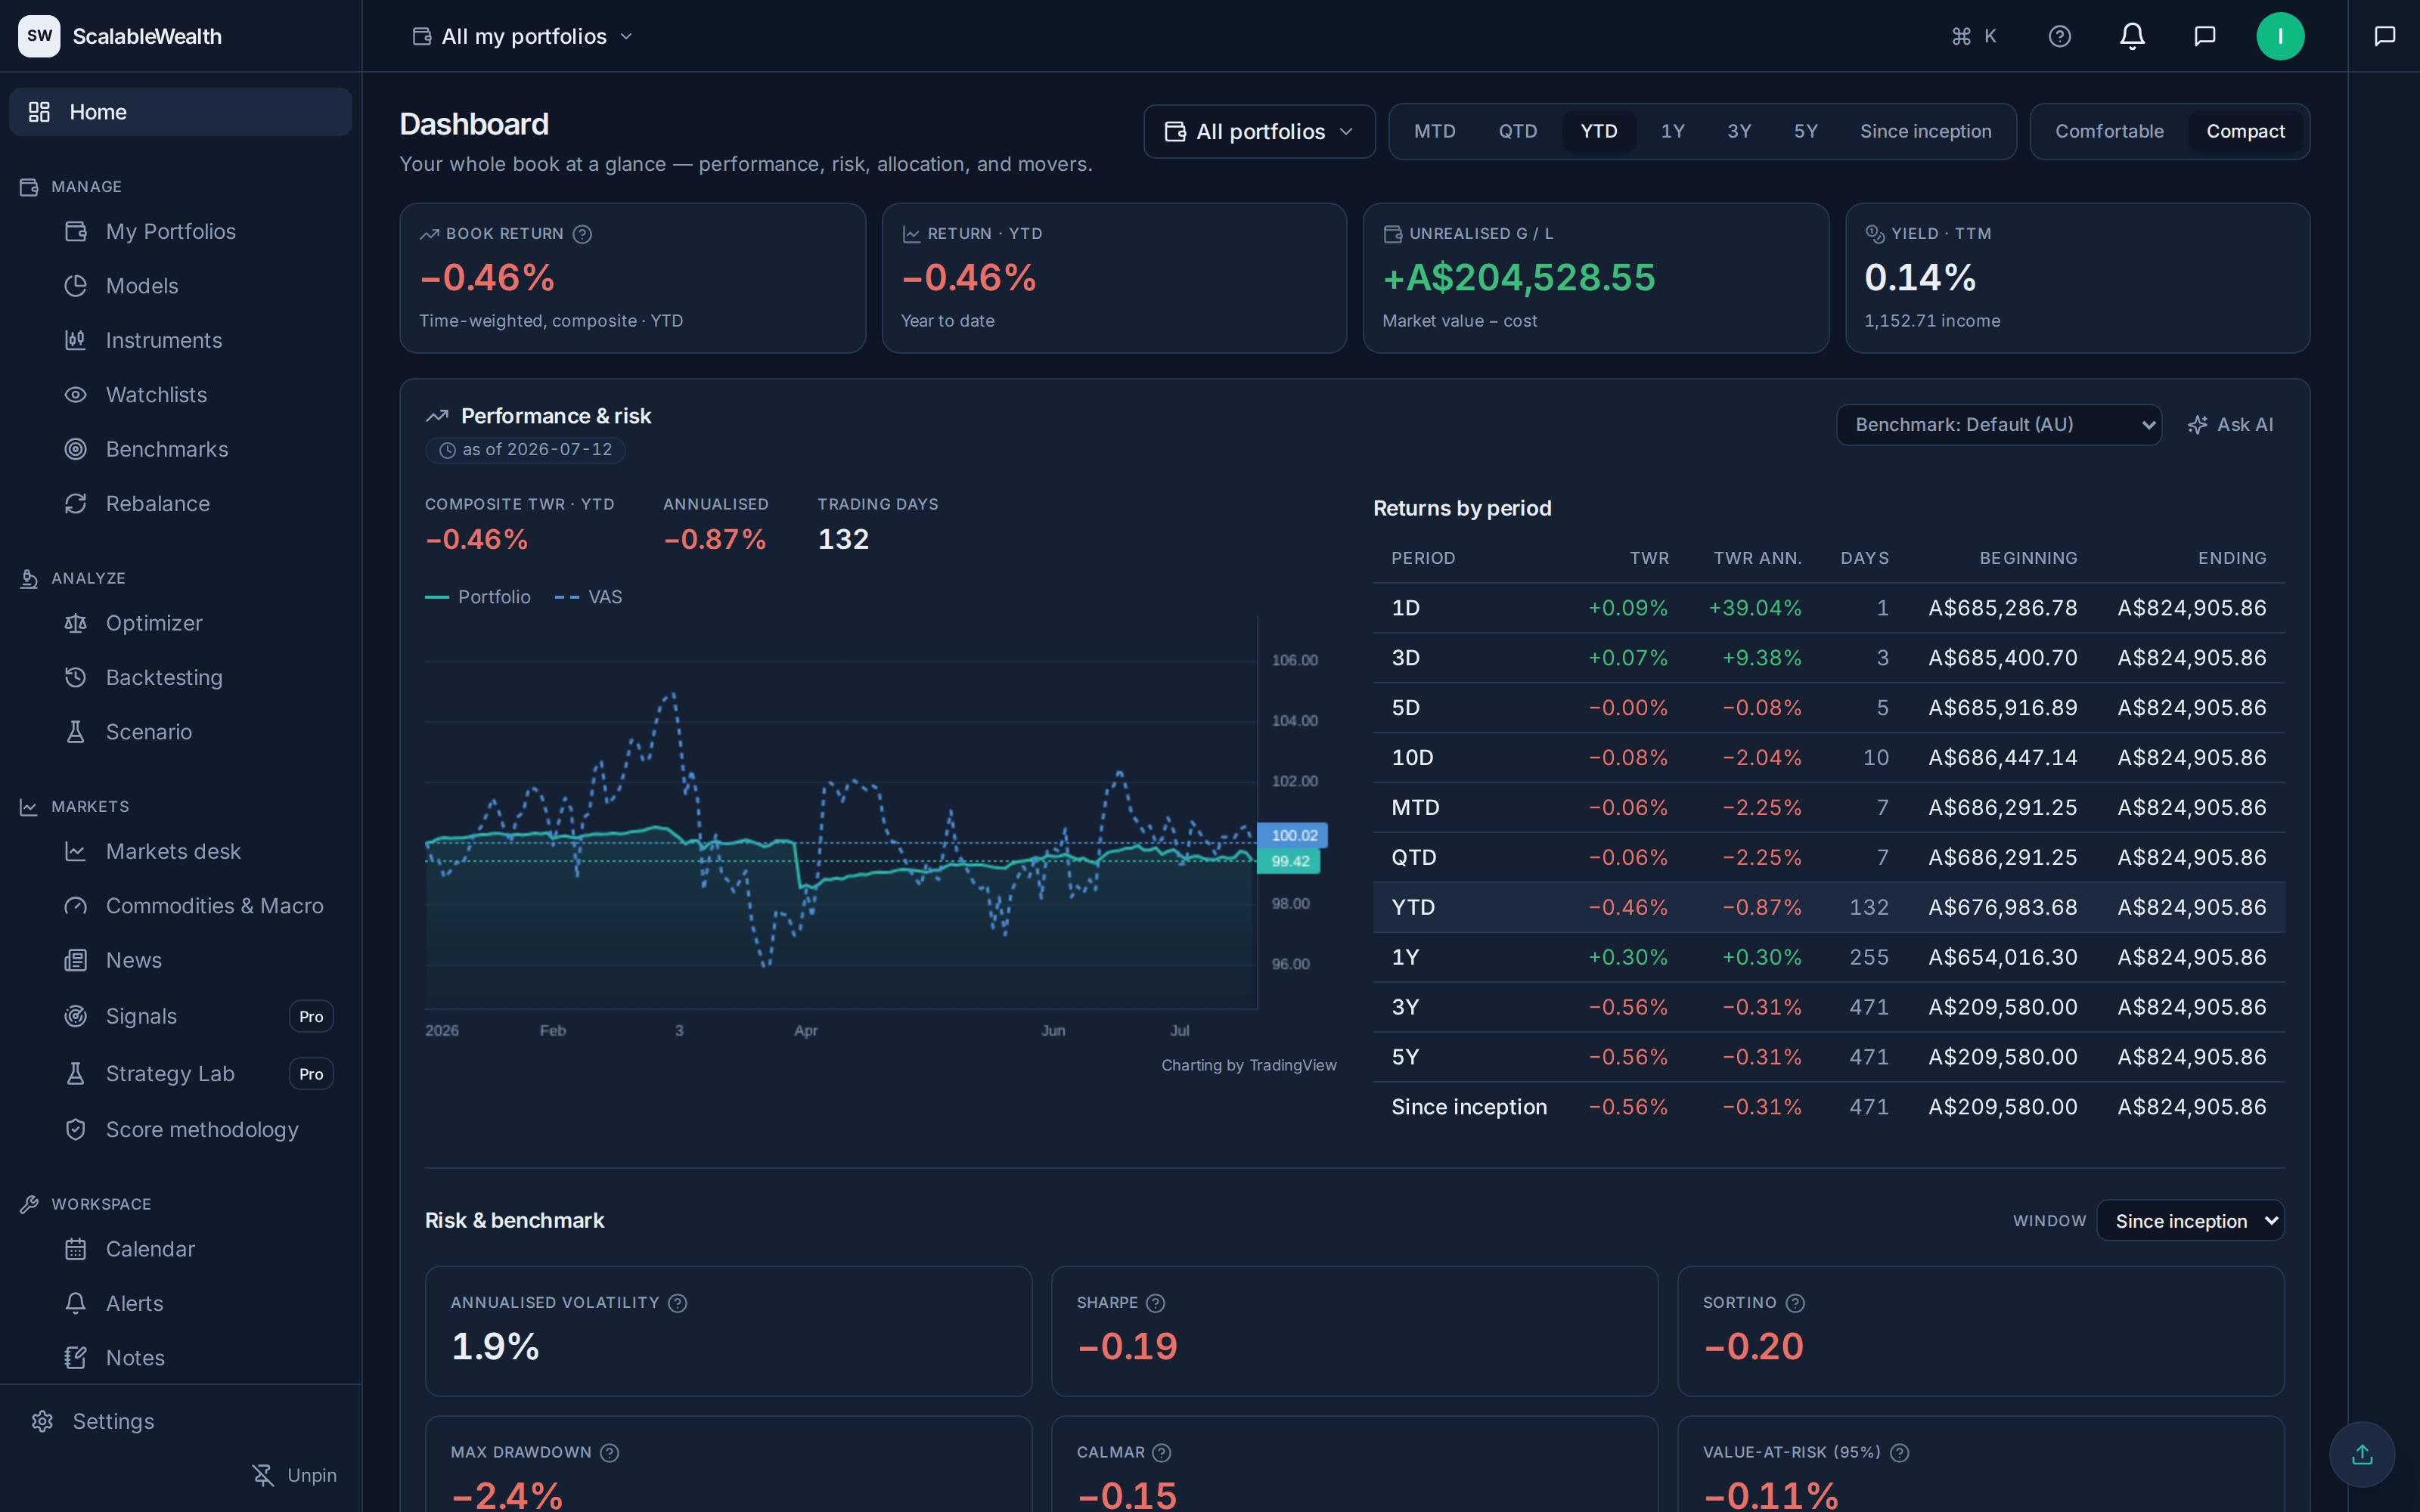
ScalableWealth Command Center dashboard in dark theme: KPI tiles for book return, YTD return, unrealised gain/loss (+A$204,528.55) and TTM yield; a performance chart of the portfolio against its VAS benchmark; a returns-by-period table across 1D, 3D, 5D, 10D, MTD, QTD, YTD, 1Y, 3Y, 5Y and since inception with beginning and ending values; and risk tiles for annualised volatility, Sharpe, Sortino, max drawdown, Calmar and value-at-risk.
Command Center · shown with demo data

ScalableWealth Intelligence

Your entire portfolio, one question away.

Ask anything in plain language, on any screen. Intelligence answers from your live holdings and the market data behind them, and cites every figure so you can verify it in one click. It reads your data through permissioned tools.

  • Every answer cites its sources, one click to verify
  • Reads your live portfolio, not a stale copy
  • Built into every screen, not a separate chatbot
ScalableWealth Intelligence
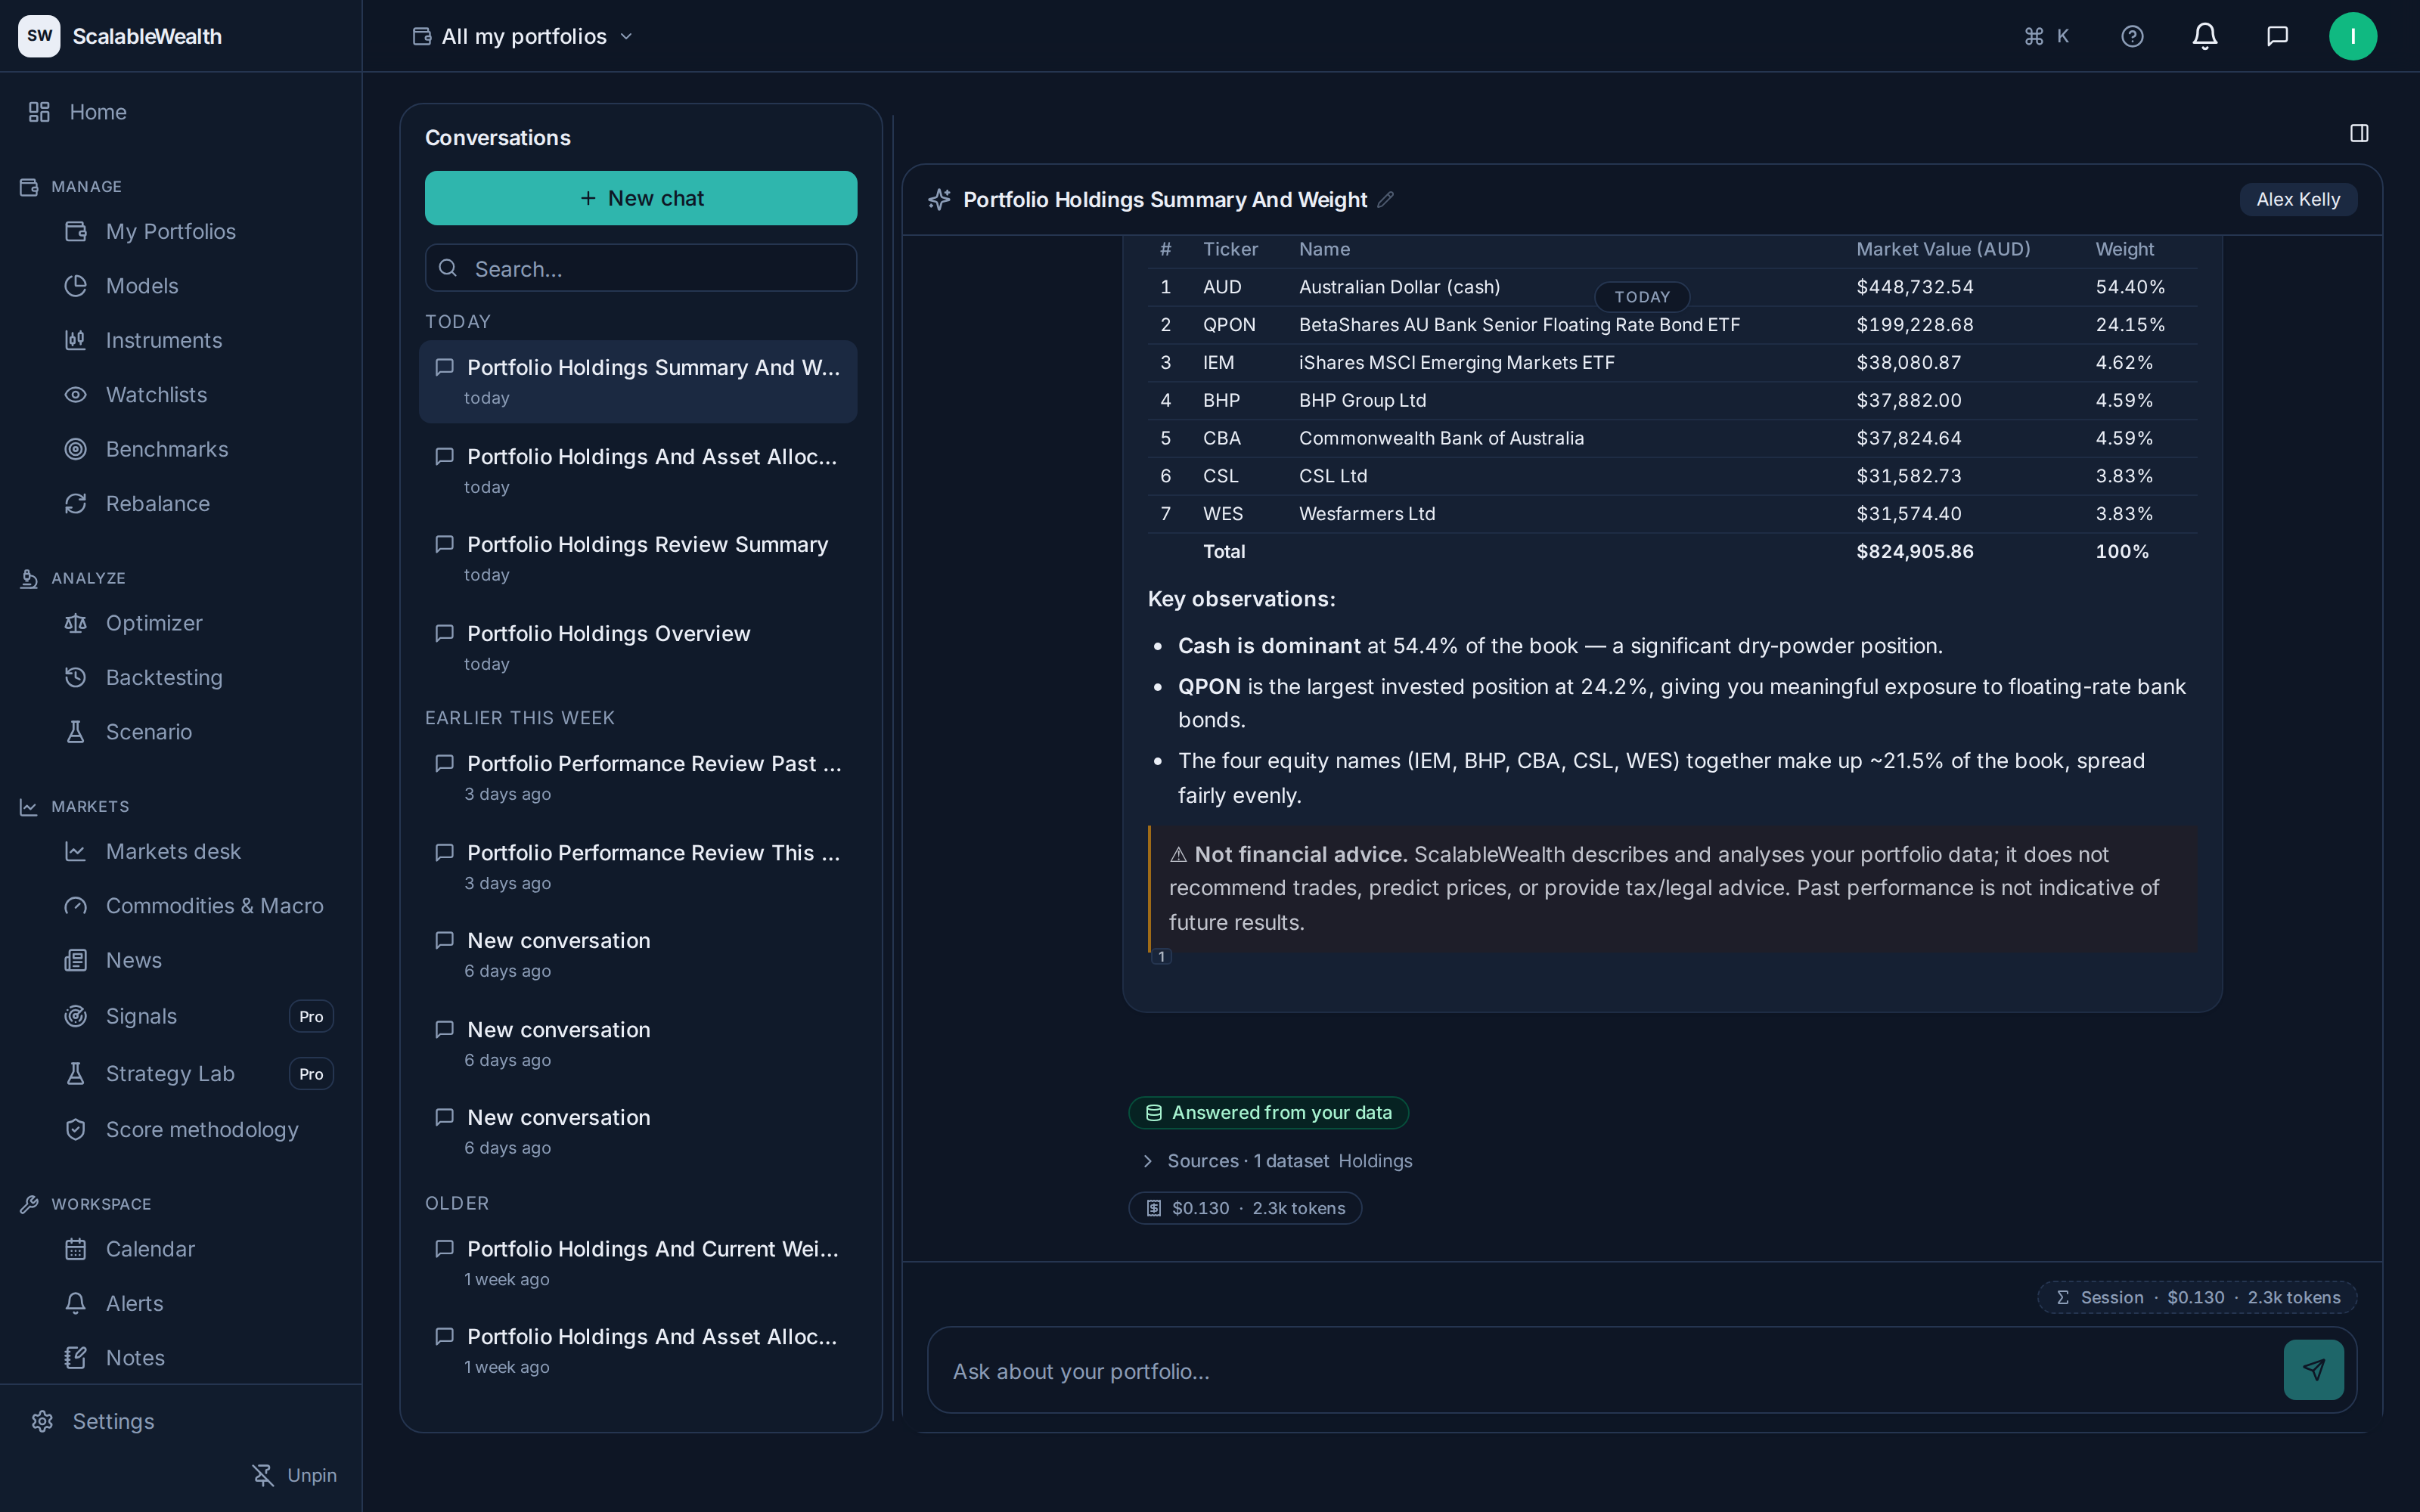
ScalableWealth Intelligence answering a portfolio question in dark theme: a 'Get book holdings' tool-call chip, a cited holdings table (AUD cash, QPON, IEM, BHP, CBA, CSL and Wesfarmers with market value and weight, book valued at AUD 824,905.86), a 'Key observations' summary, a 'Not financial advice' notice, and an 'Answered from your data' badge above a Sources row with the answer's token cost.
Answered from your data · with sources

The platform

From a question to a decision, in one place.

Institutional depth, built for the individual investor. Research, analytics, rebalancing and reporting, wired together so a question anywhere becomes a decision. Import your portfolio from a broker CSV in minutes. No exporting, no spreadsheets, no gaps.

Command Center

Your whole position, on one screen

Total value, today's move, year-to-date performance, unrealised gains and yield, with risk measures beside them. Every headline number is computed properly, timestamped, and drills down to the holdings behind it.
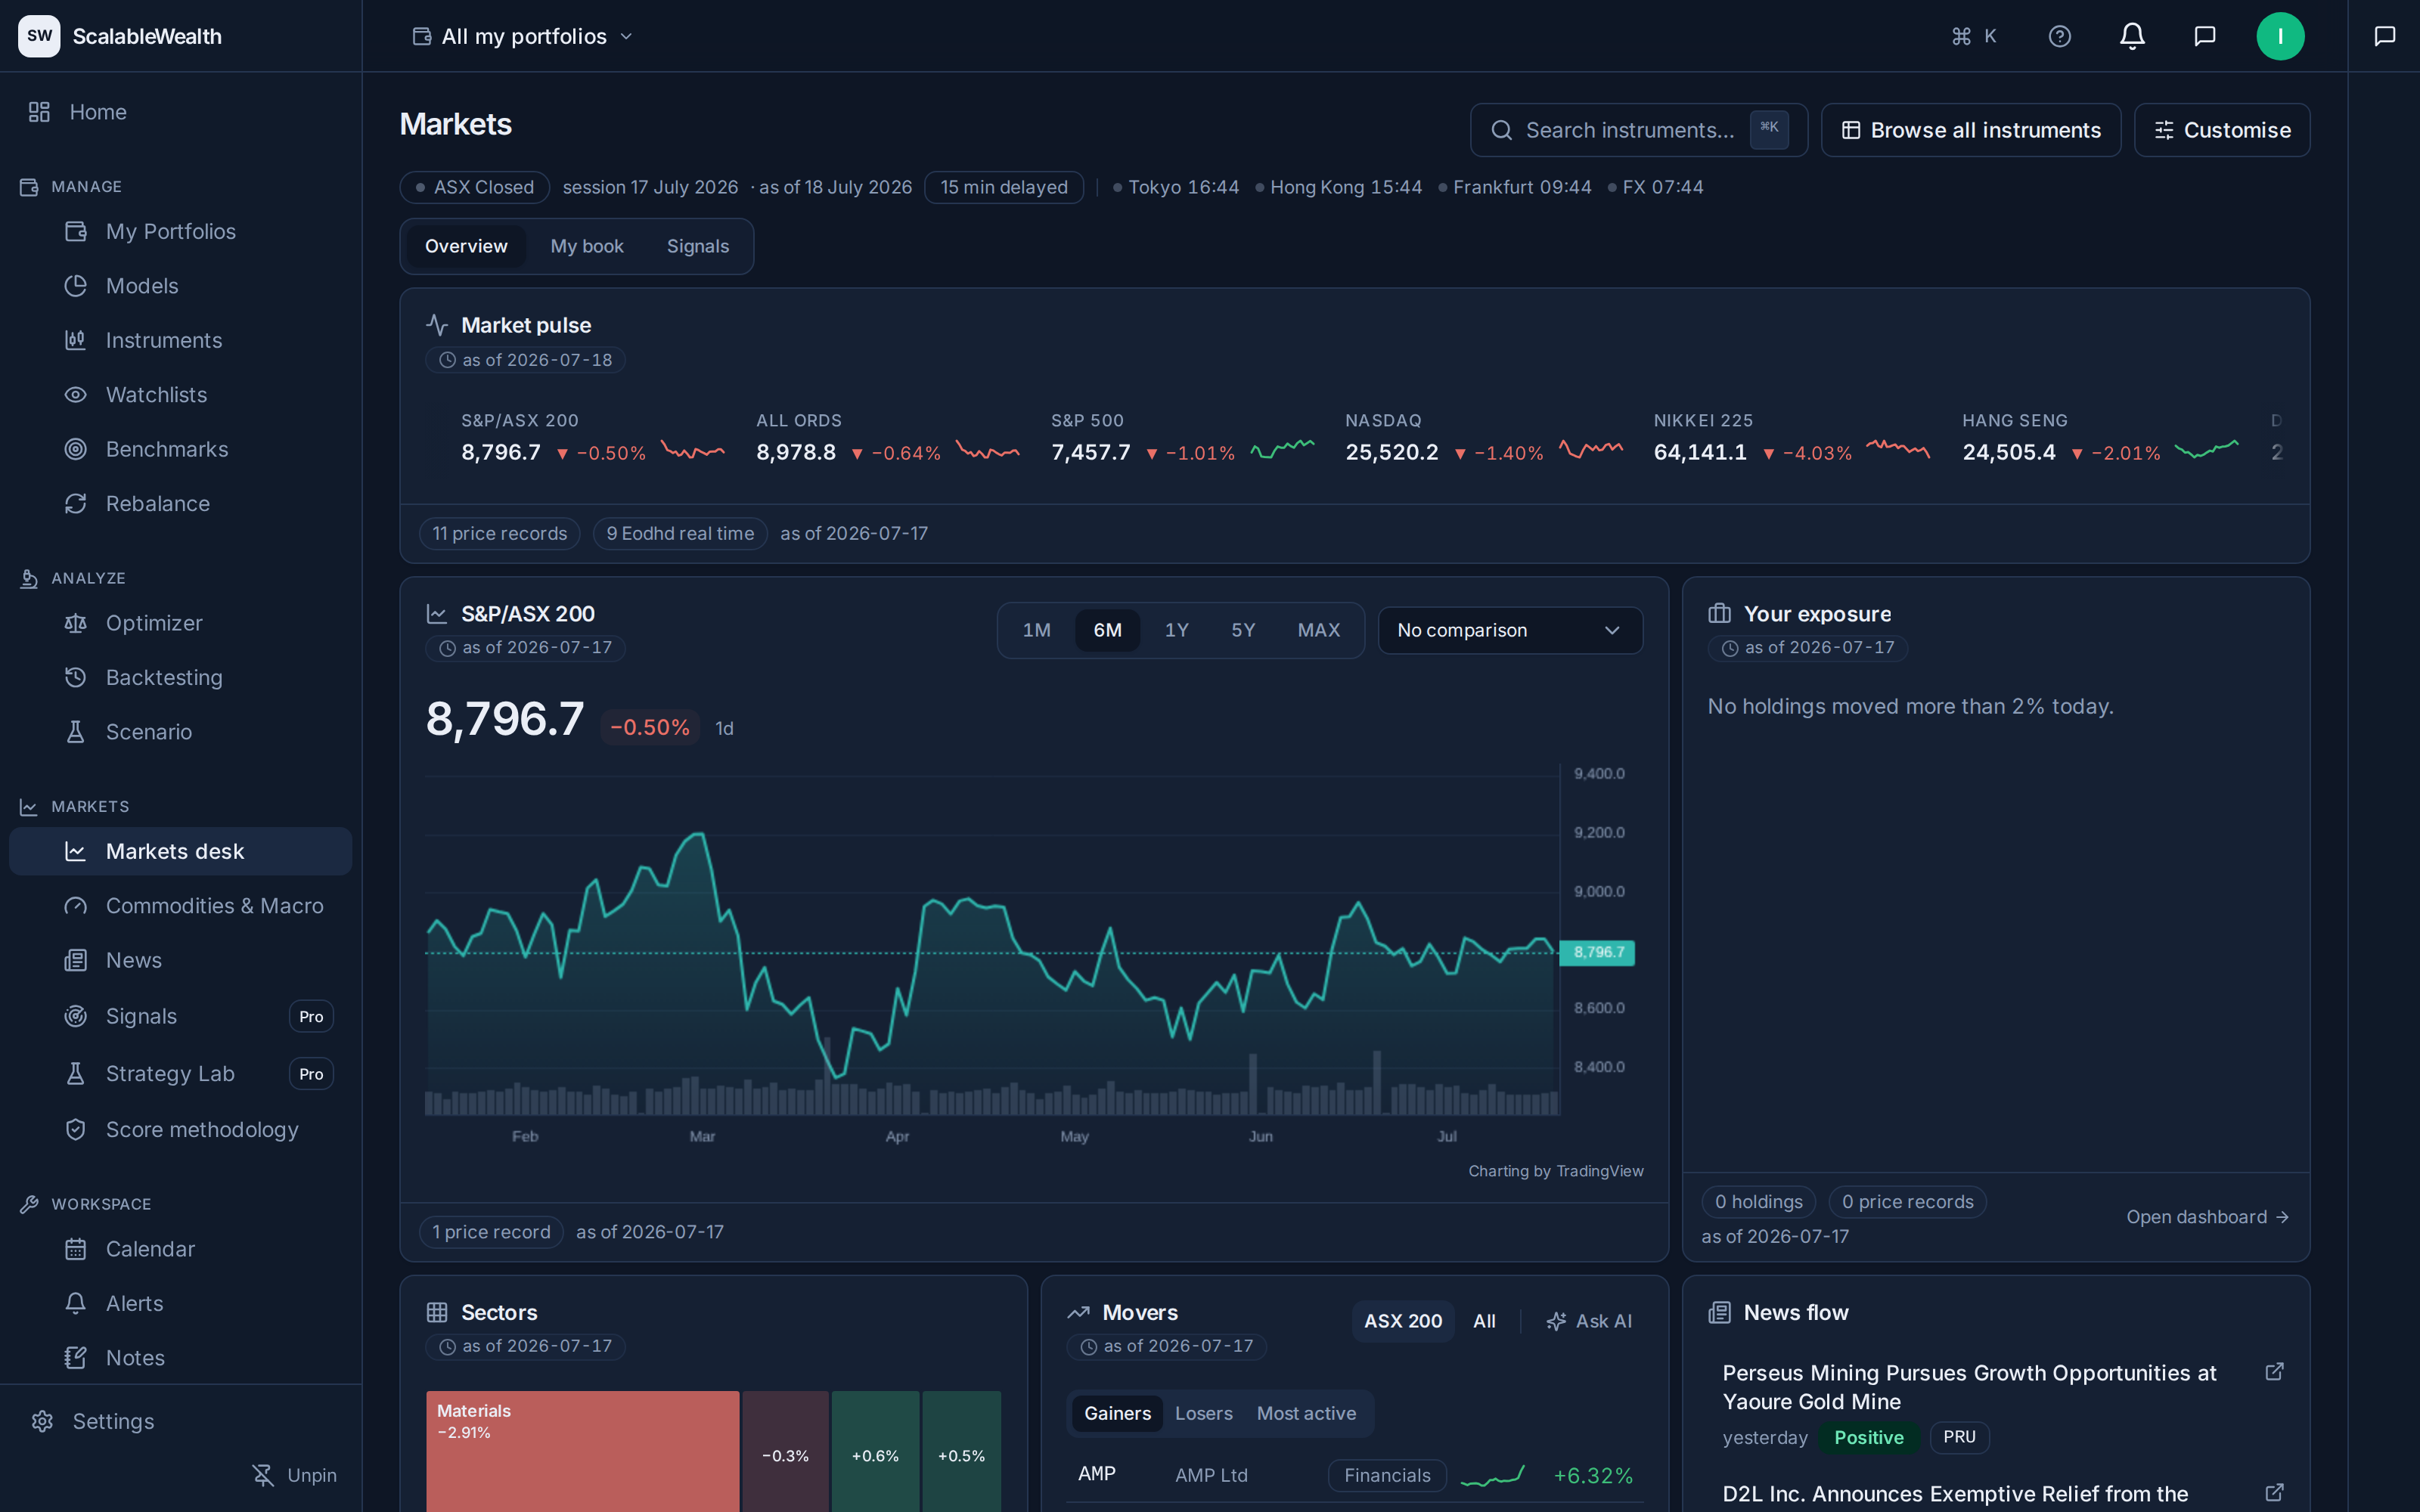
Markets desk

Markets, linked to your portfolio

Indices, sectors, movers and news on one screen. Select any instrument and every panel follows: price, fundamentals, signals, and your position in it. Every figure is stamped with how current it is.

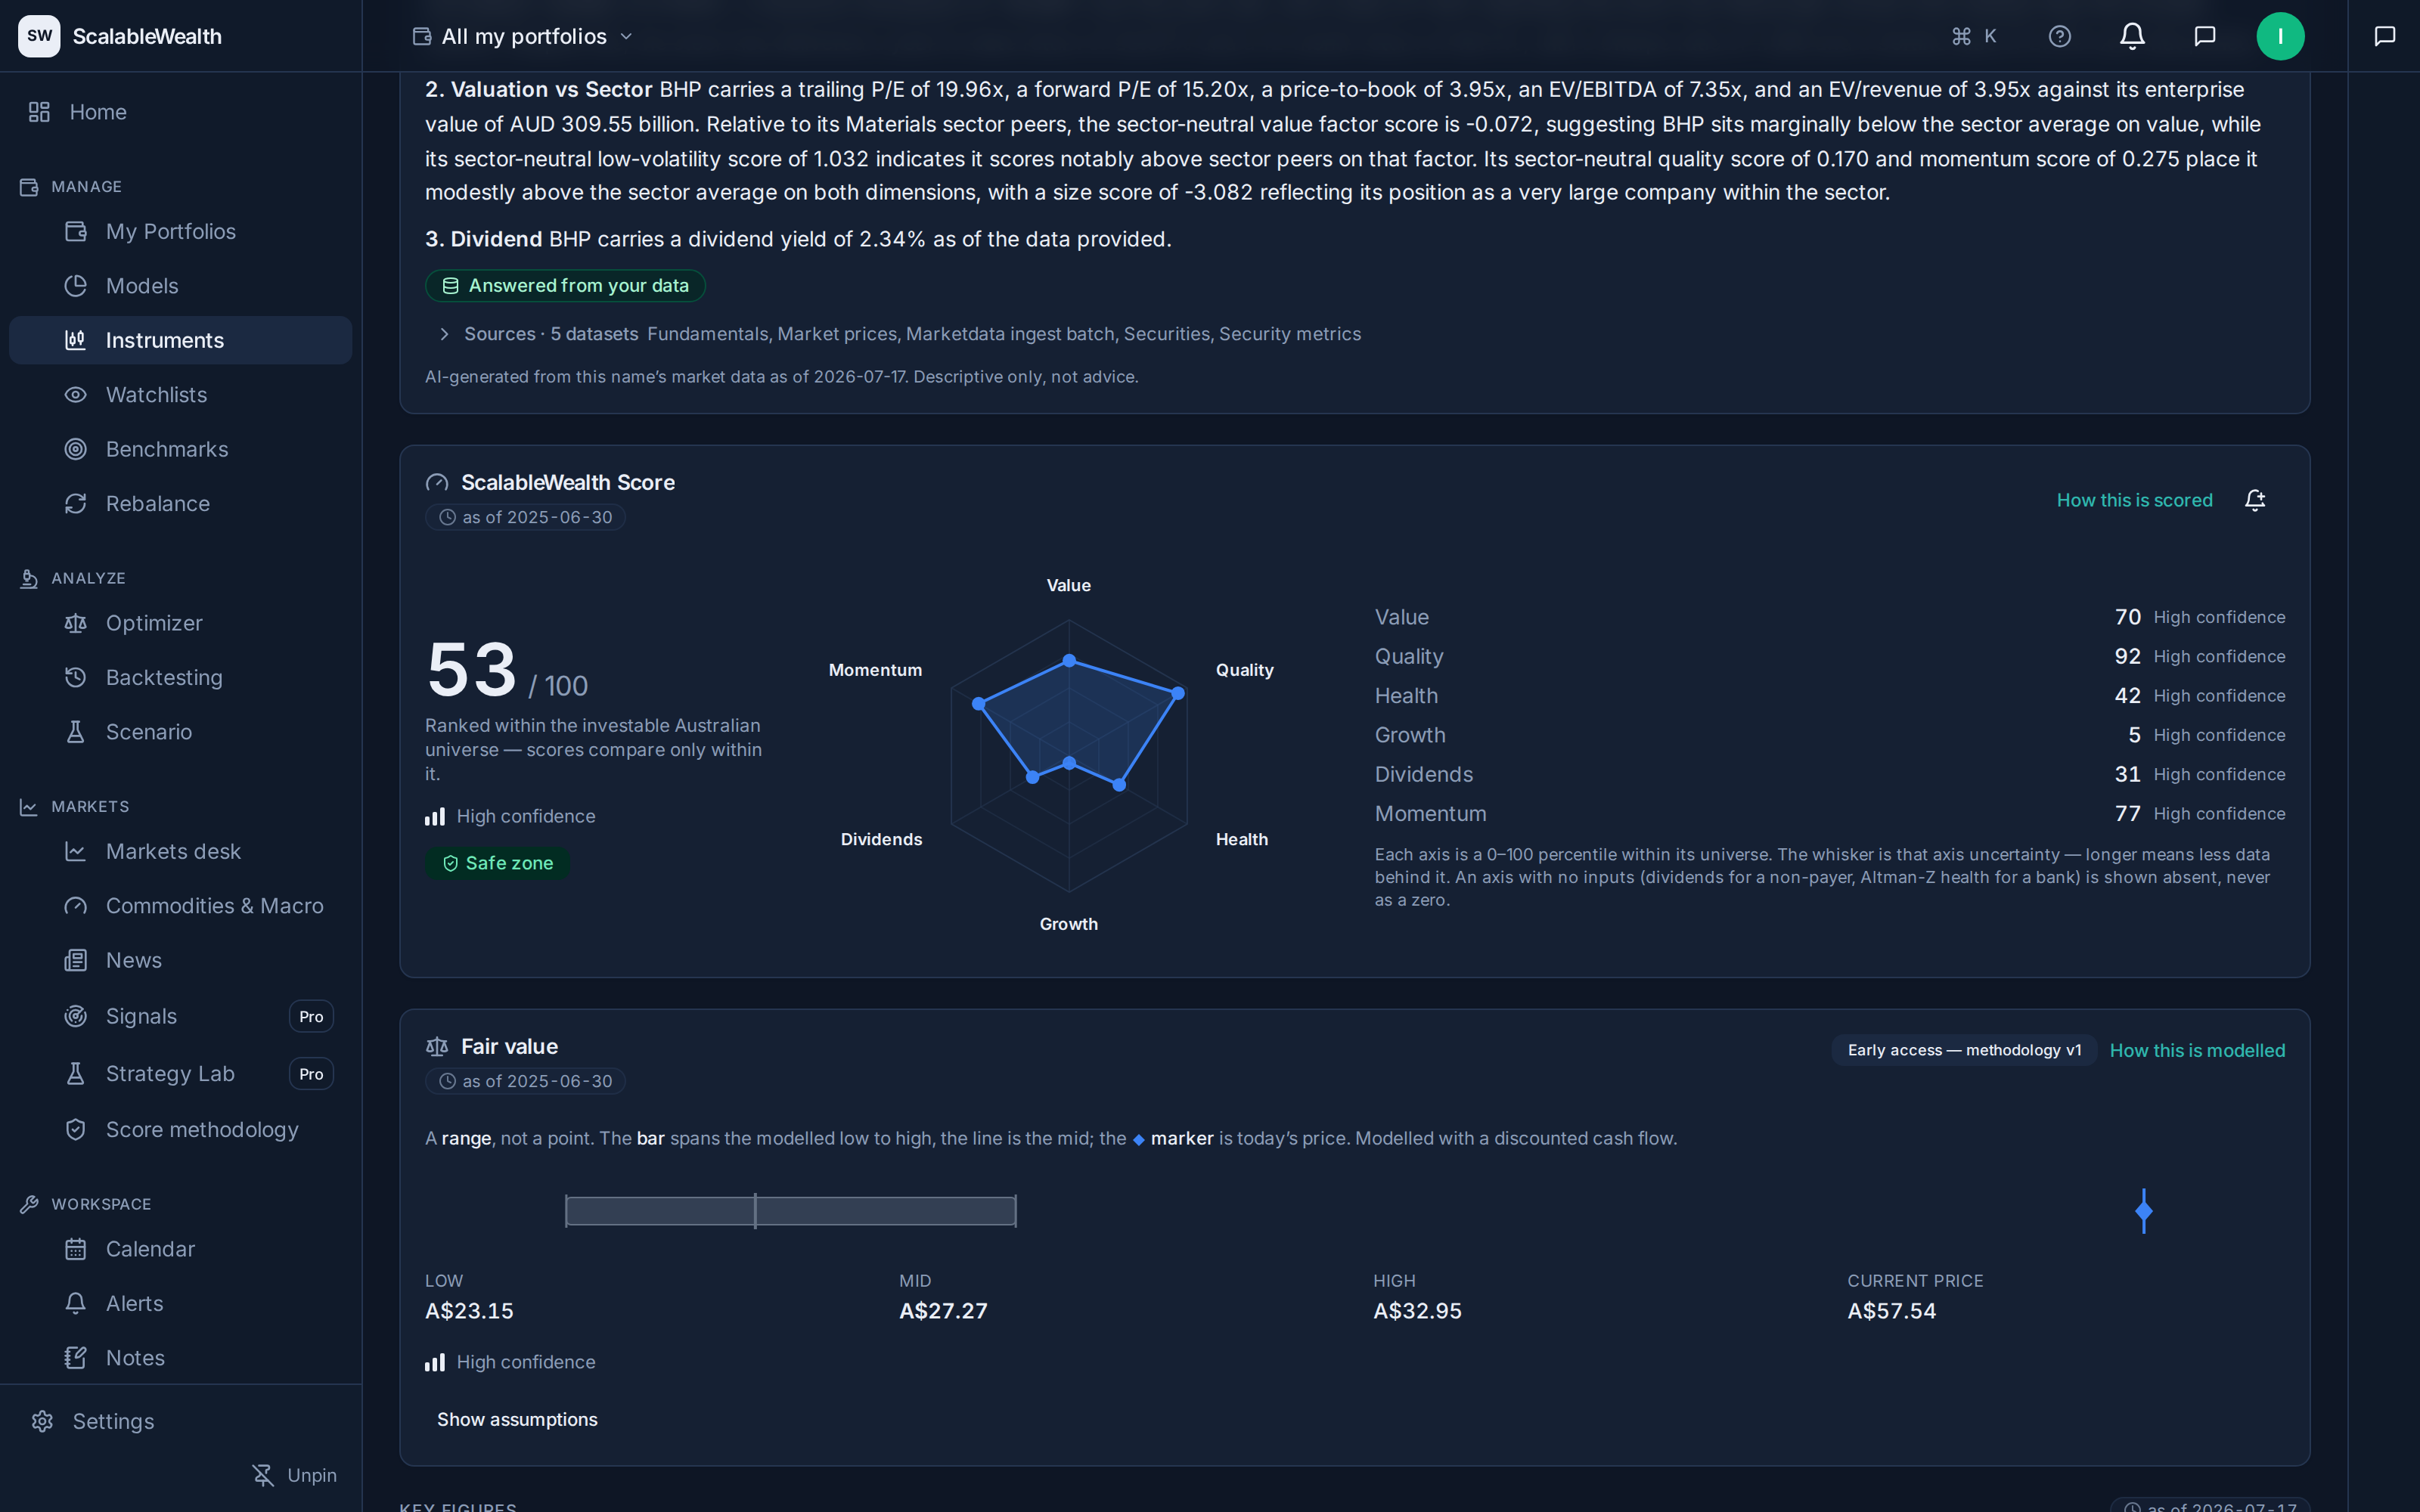
Instruments · ScalableWealth Score

A stock score you can audit

Every covered stock is scored on six dimensions, with published, versioned weights and an honest confidence label where data is thin. Behind the score: full financial-statement history, analyst estimates with a beat-and-miss record, peer comparisons, complete ETF look-through, and a modelled fair-value range that shows its assumptions.

Portfolios · Rebalance

Rebalancing as a proposal, not a mystery

Hold real and model portfolios side by side, set a target allocation, and get a concrete proposal: the exact trades, the drift they close, what they cost, and where selling would realise capital gains. You review every order. We never place them.

Models · Screener · Optimizer · Backtest

Test a strategy before you trust it

Screen every covered name on more than 150 fields, build a model portfolio, optimize it against your constraints, and backtest it against a benchmark, with every step showing its working. No black boxes.

Alerts

Told when it matters

Price moves, return thresholds, portfolio drift, dividend ex-dates and news. On the research side: score changes, names entering or leaving your screens, new financial filings. All opt-in, all scoped to what you actually follow.

Plus factor signals that state their limits, watchlists and curated news, full-text-searchable documents and notes beside your holdings, and a calendar of what's ahead.

Coming from a stock research tool? See the side-by-side comparison

See the platform

This is what the platform looks like.

Real screens, demo data. Four of the surfaces you'll work in every day.

Markets
ScalableWealth Markets desk in dark theme: a market-pulse strip of index quotes (S&P/ASX 200, All Ords, S&P 500, Nasdaq, Nikkei 225, Hang Seng), each with its change and sparkline; a six-month S&P/ASX 200 chart around 8,797; a sector heatmap, a gainers/losers/most-active movers list and a news-flow panel; the market shown as closed and quotes 15-minutes delayed.

Markets desk

Select once and every panel follows: market pulse, the index chart, sectors, movers and news, each figure stamped with how current it is.

ScalableWealth Score
ScalableWealth instrument page for BHP Group in dark theme, showing the ScalableWealth Score: a composite of 53 out of 100 ranked within the investable Australian universe, a "Safe zone" integrity pill, and a six-axis radar (value, quality, health, growth, dividends and momentum), each with its percentile (for example quality 92, growth 5) and a "high confidence" label. Below it a modelled fair-value range of A$23.15 to A$32.95 against a traded price of A$57.54, carrying an "Early access, methodology v1" badge and a "show assumptions" control.

Instruments · ScalableWealth Score

A verdict you can audit: the composite score, six dimensions with per-axis confidence, integrity checks beside the number, and a fair-value range with its assumptions shown.

Portfolio
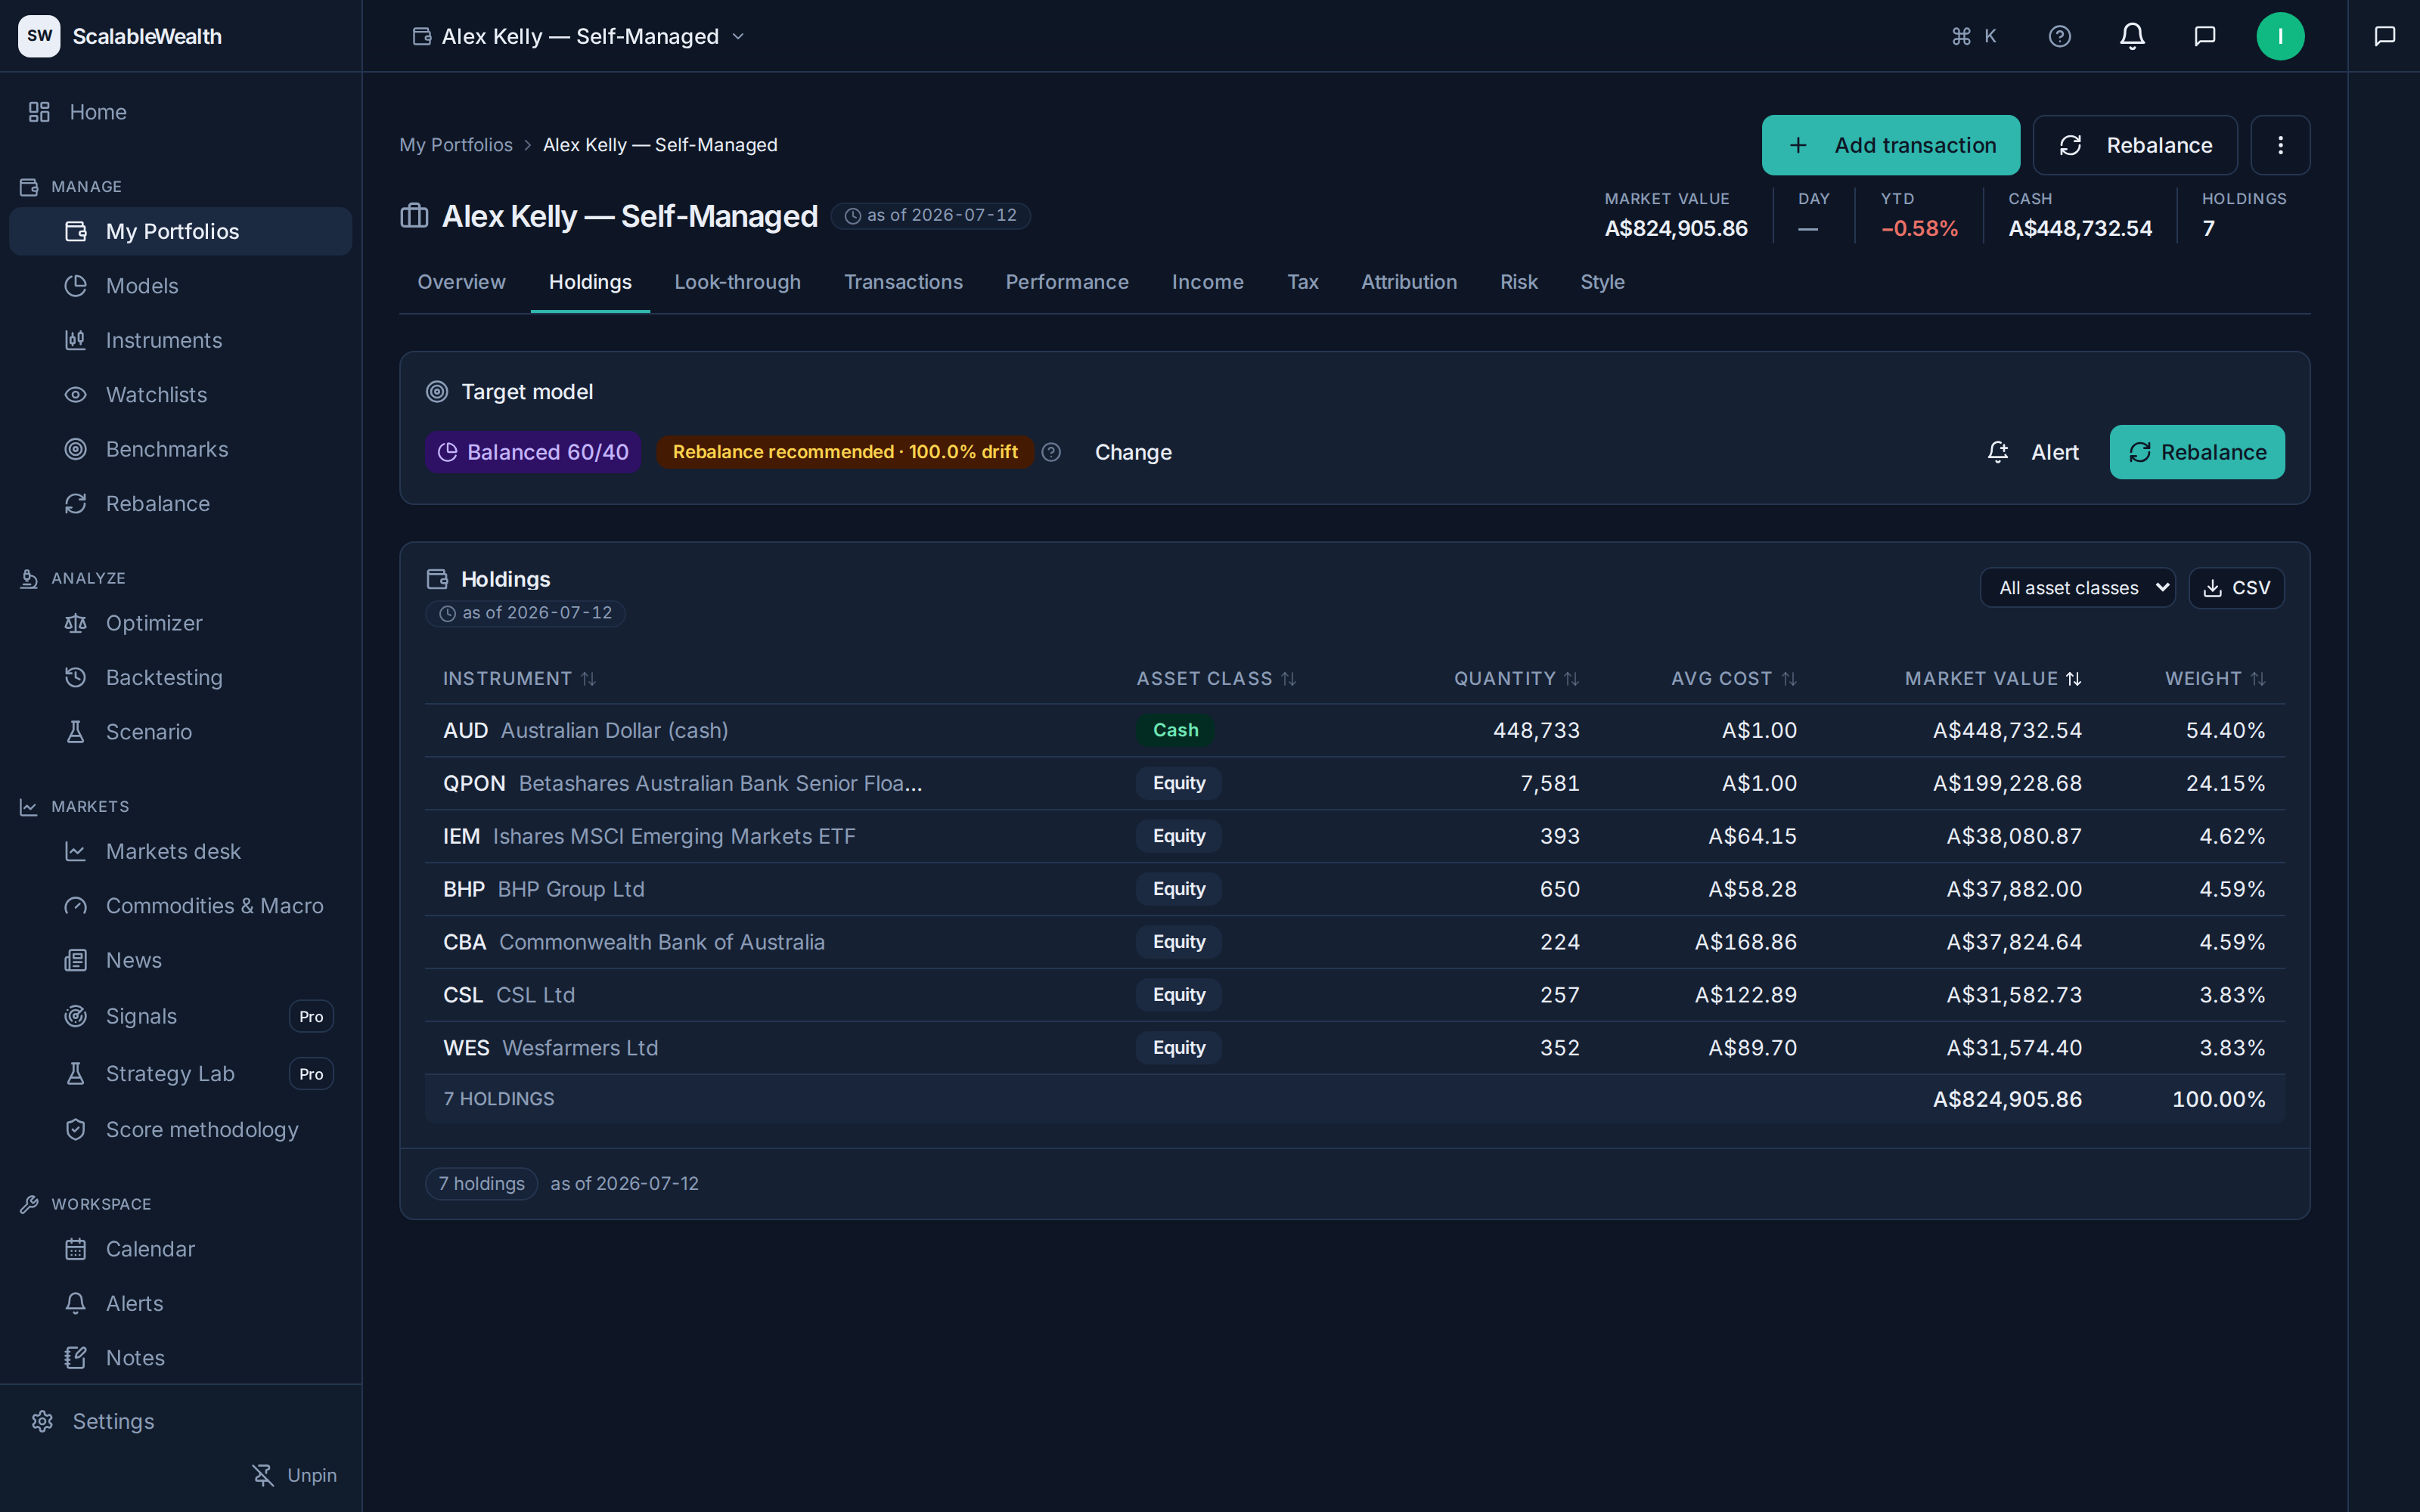
ScalableWealth portfolio detail for "Alex Kelly — Self-Managed" in dark theme: market value A$824,905.86, cash A$448,732.54 and seven holdings, a "Balanced 60/40" target model with a "Rebalance recommended · 100.0% drift" banner, and a holdings table listing AUD cash, QPON, IEM, BHP, CBA, CSL and Wesfarmers with quantity, average cost, market value and weight.

Portfolios · Rebalance

Value, cash and holdings at the top; a target model with live drift below; one click to a fully costed rebalance proposal.

Backtest
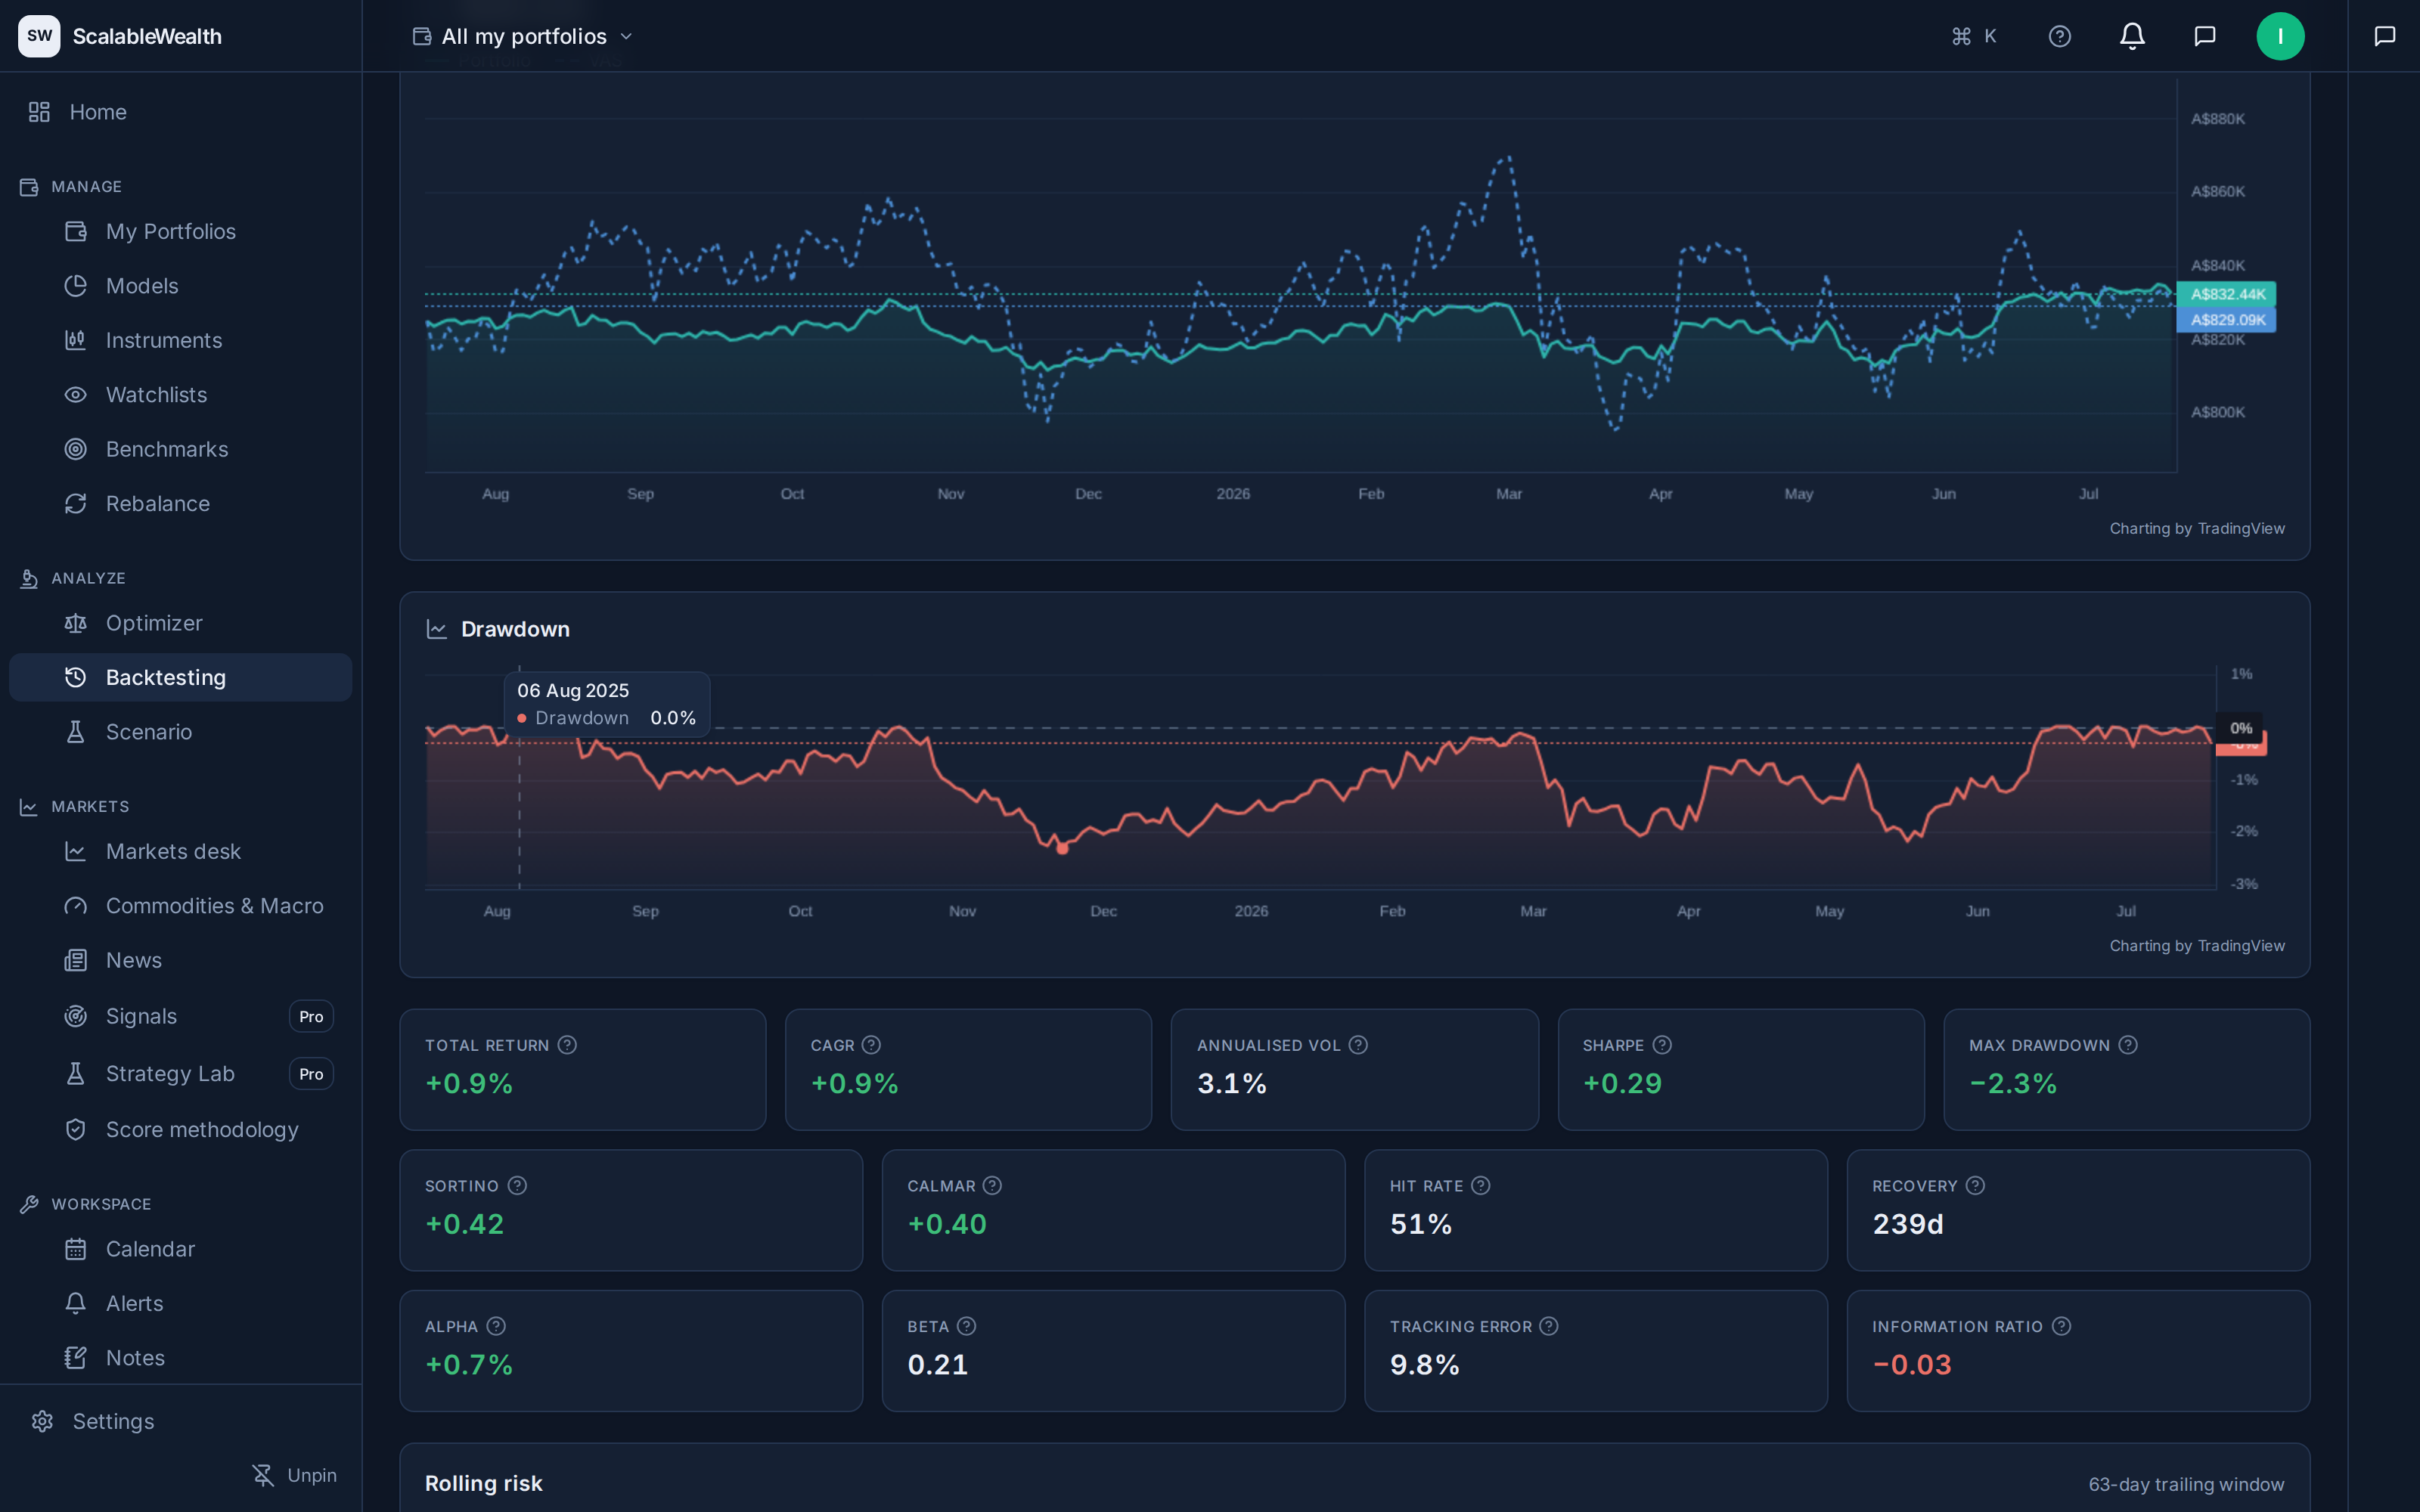
ScalableWealth backtest results in dark theme: an equity curve of the portfolio (ending A$832.44K) against its VAS benchmark (A$829.09K), a drawdown chart below it, and a grid of metric tiles: total return +0.9%, CAGR +0.9%, annualised volatility 3.1%, Sharpe +0.29, max drawdown −2.3%, Sortino, Calmar, hit rate, alpha, beta, tracking error and information ratio.

Backtest

Test any model against its benchmark: growth, drawdown and the metrics that matter, with every assumption visible.

Where we stop, on purpose

Advisory by design.

We take you all the way to a costed, checked proposal and stop there. Execution is out of scope by design, not a missing feature: your money stays with your broker, and we never hold funds or account credentials. Underneath, data access is permissioned, every tool call lands in an append-only audit log, and every number is reproducible as of any point in time. It is the same engineering a professional multi-portfolio operation runs on.

Founding members

Join early, keep the founding rate.

Everyone who joins during early access is a founding member. When paid plans launch, founding members will be offered A$25 a month, held for the life of the account. Nothing is charged today, and we don't collect a card.

See pricing

Early access

Start scaling your wealth.

Full access to the whole platform, free during early access. No card required.